Building a graph
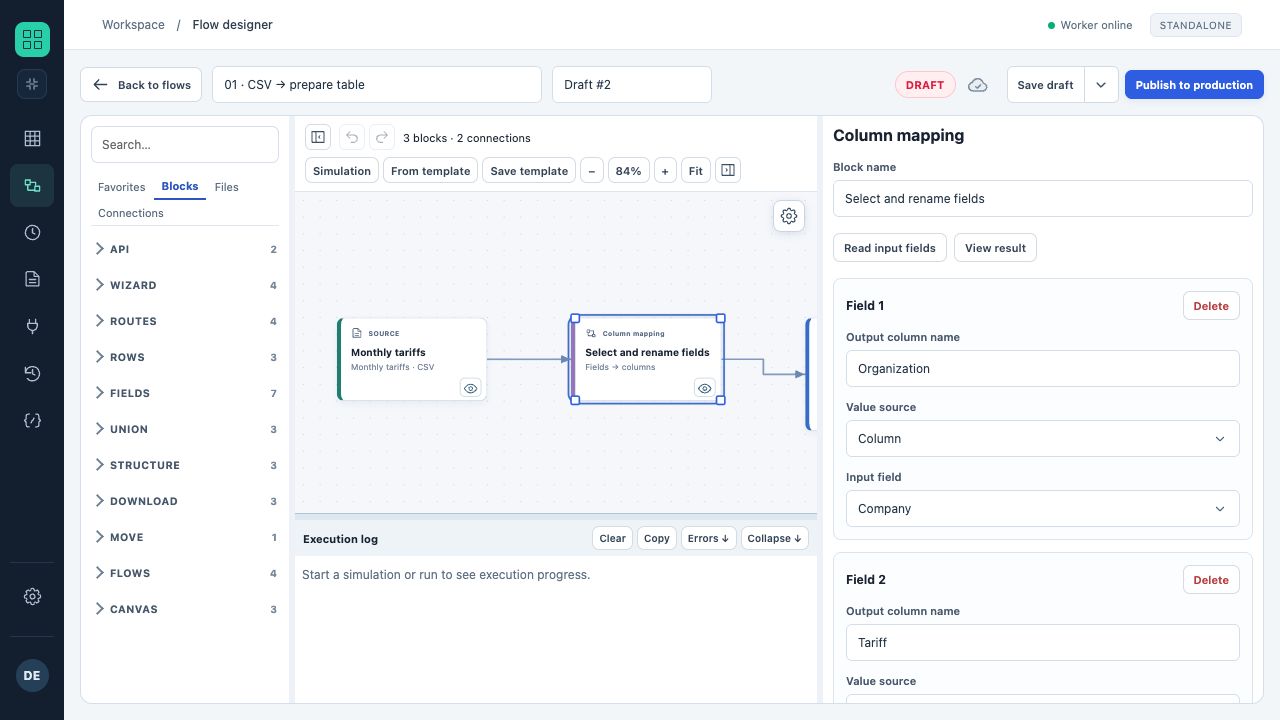
A draft CSV → mapping → CSV flow. The palette is on the left, blocks and links in the center, and selected-block properties on the right.
- The palette adds blocks, files and connections.
- Properties change when a block is selected on the canvas.
- Simulation and promotion to Production are separate actions.
- Create a draft and name the flow.
- Add required blocks from the palette; start with sources, then transformations and destinations.
- Connect output and input ports in the required direction.
- Select a block and configure its fields in the properties panel.
- Use input/output previews to check column names before the next step.
Connection rules
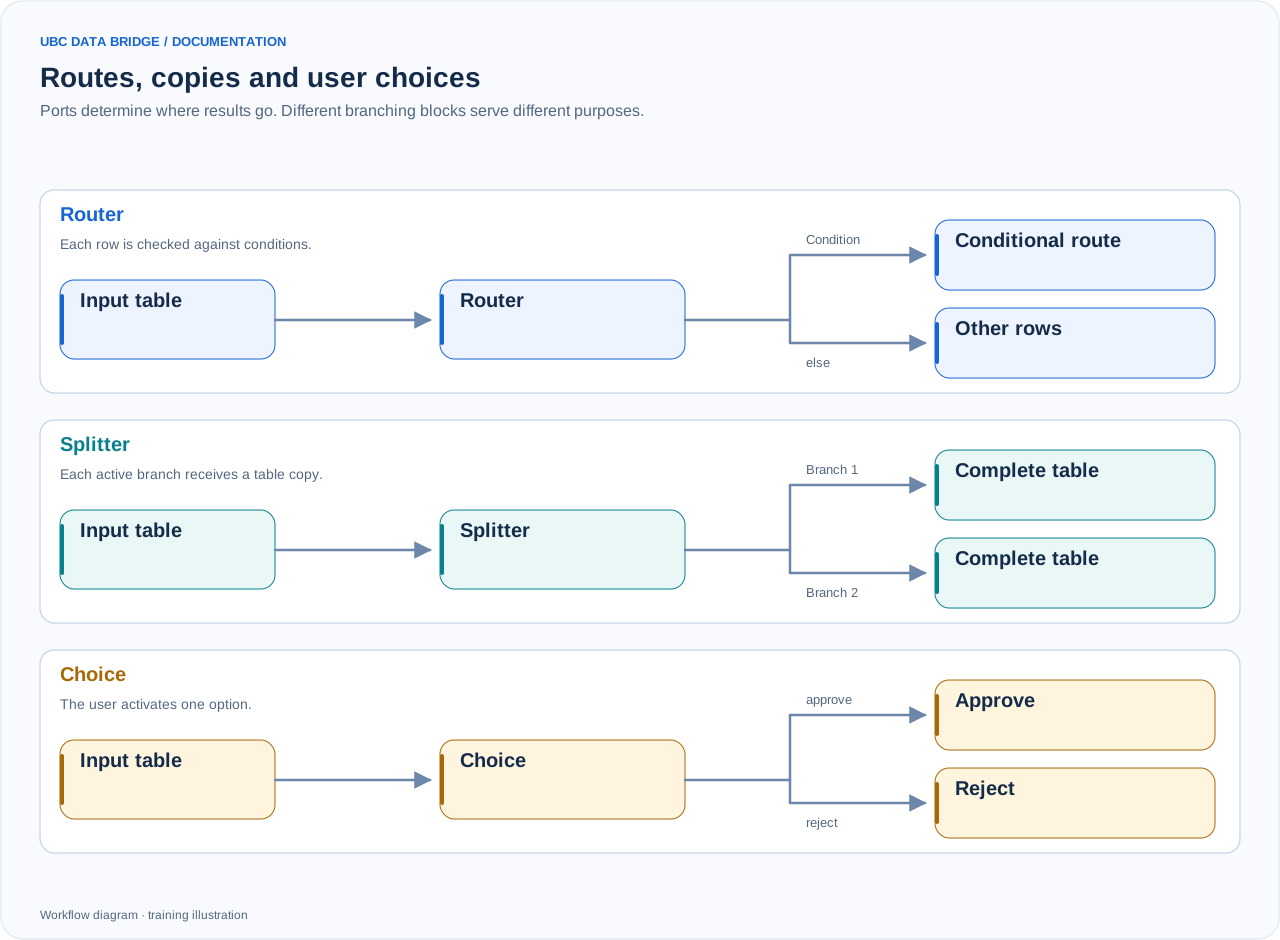
Comparison of Router, Splitter and user Choice. Router can use first-match or all-matches modes; the diagram shows a simple route and else. Merge also waits for an inactive-input signal.
- The graph must not contain cycles.
- A port's name defines its meaning: data, reference, a separate branch, success or error.
- Union and Join have several configured inputs; their order can affect the schema and result.
- Special cube mapping must be followed directly by an IBM destination. Perform ordinary table transformations before it.
Checking a block
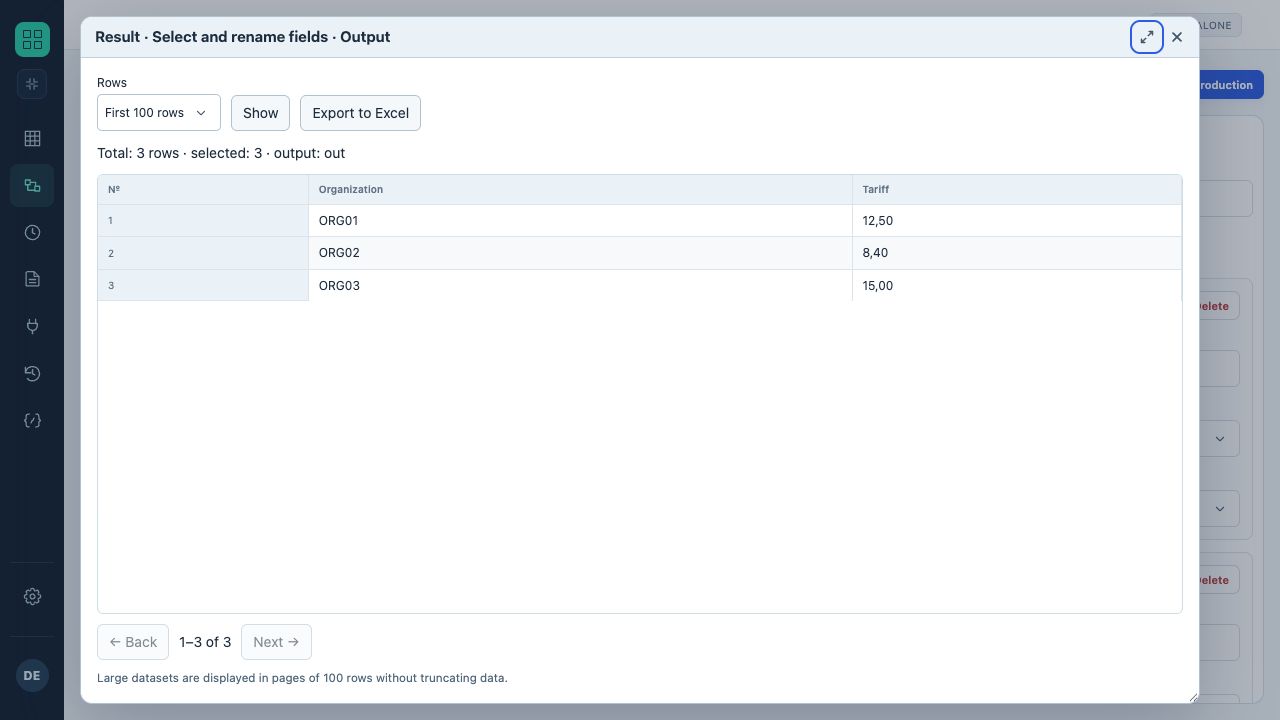
The mapping-result window shows three training rows, output field names, a row count and export controls.
- This is a block output preview in the designer.
- For a large table, you can change the row count and navigate pages.
Reread fields after changing a source. If a column was renamed, check all subsequent references. Open the block table and inspect row counts, types and empty values. Test every branch with separate training data, including a case where no condition matches.
Notes and arrows
You can add explanatory notes and arrows to the canvas. They are saved with the flow and help explain business logic. These elements do not execute or carry data; block-port links determine processing order.
A practical configuration sequence
First obtain the correct source table, then normalize types, apply business rules and only then configure writes. Name blocks by their outcome: “Active contracts only”, “Monthly total”, “Write sales plan”.
Palette, search and favorites
The palette provides blocks, files, connections and favorites. Block groups follow the task: API, wizard, routes, rows, fields, combining, structure, export, file transfer, flows and canvas. Search includes names and descriptions and expands matching groups. The context menu collapses or expands all groups. Favorites belong to the user and are available across flows. Unused inbound endpoints and API publications have a separate connection group.
Block groups and workspace
Place related blocks in a group frame and collapse it to focus on another part of the process. Names, colors, notes and arrows explain the diagram; port connections determine execution order. Production groups can be expanded or collapsed for viewing without saving changes. Collapse the palette, properties and log to free canvas space, then use “Fit” to show the entire graph. The subflow eye icon opens its Production version over the current designer.