Task and prerequisites
Calculate revenue for each sale and prepare a summary table by region.
This example uses demonstration data and settings. Validate the expected result in your own environment before connecting production destinations. Identifiers demo_* are illustrative: select your own training connections or sources in the editor. The JSON below shows the block and connection structure, not a ready-to-transfer flow archive.
Training input data
sales.csv
Region;Qty;Price
North;2;10
North;3;5
South;4;7.5
Blocks, connections and exact settings
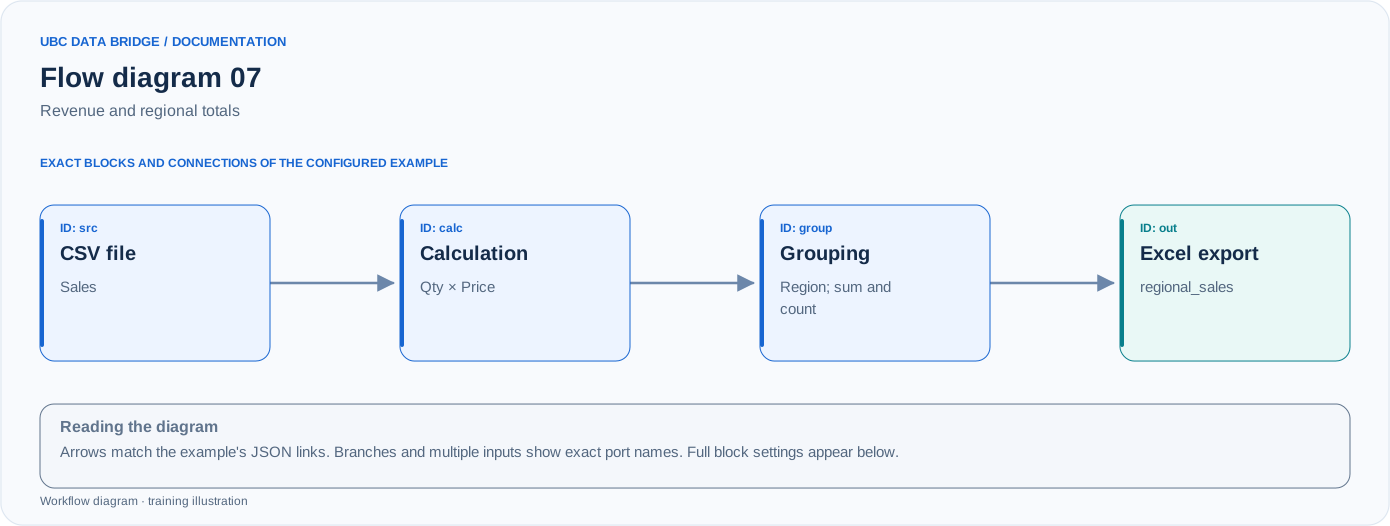
Example 07 topology: 4 blocks, 3 connections. Node identifiers and ports from the configured graph are preserved.
Add the listed blocks in the designer, open each block's properties and set these values. Names demo_* identify training sources and connections.
| Block | Setting |
|---|---|
| 1 File src |
|
| 2 Calculated fields calc |
|
| 3 Grouping group |
|
| 4 Data export out |
|
Port connections
- src
out→ calcin - calc
out→ groupin - group
out→ outin
Complete graph configuration as JSON
{
  "version": 3,
  "nodes": [
    {
      "id": "src",
      "type": "file",
      "label": "src",
      "config": {
        "role": "source",
        "source_id": "demo_sales_calc",
        "options": {
          "sheet": "CSV",
          "range": "A1:C4",
          "header": true,
          "delimiter": ";"
        }
      }
    },
    {
      "id": "calc",
      "type": "calculation",
      "label": "calc",
      "config": {
        "fields": [
          {
            "name": "Revenue",
            "expression": "round(number(field(\"Qty\")) * number(field(\"Price\")), 2)"
          }
        ],
        "decimal": "."
      }
    },
    {
      "id": "group",
      "type": "group",
      "label": "group",
      "config": {
        "keys": [
          "Region"
        ],
        "aggregates": [
          {
            "column": "Revenue",
            "op": "sum",
            "name": "RevenueTotal"
          },
          {
            "column": "Revenue",
            "op": "count",
            "name": "Orders"
          }
        ],
        "decimal": "."
      }
    },
    {
      "id": "out",
      "type": "export",
      "label": "out",
      "config": {
        "format": "xlsx",
        "filename": "regional_sales",
        "destination": "download",
        "delimiter": ";",
        "timezone": "Europe/Kyiv"
      }
    }
  ],
  "edges": [
    {
      "source": "src",
      "target": "calc",
      "source_port": "out",
      "target_port": "in"
    },
    {
      "source": "calc",
      "target": "group",
      "source_port": "out",
      "target_port": "in"
    },
    {
      "source": "group",
      "target": "out",
      "source_port": "out",
      "target_port": "in"
    }
  ]
}
Expected result
| Region | RevenueTotal | Orders |
|---|---|---|
| North | 35 | 2 |
| South | 30 | 1 |
Calculated Revenue values before grouping are 20, 15 and 30. Total revenue is 65.
Run and verify
- Check the decimal separator: 7.5 uses decimal=".".
- Create a calculated Revenue field, then group by Region.
- Run and verify totals 35/30 and counts 2/1; do not compare only the overall row count.
Common errors
- The formula does not execute arbitrary code: functions and operations must come from the reference catalog.
- For names with spaces, use field("Field name").
- Adding Qty or Price as grouping keys creates extra groups instead of a regional total.