Task and prerequisites
Read a public IBM Planning Analytics cube view and pass it to a tabular report.
This example uses demonstration data and settings. Validate the expected result in your own environment before connecting production destinations. Identifiers demo_* are illustrative: select your own training connections or sources in the editor. The JSON below shows the block and connection structure, not a ready-to-transfer flow archive.
DemoSales, Demo_Actual_Jan and demo_pa are training names. For an exact comparison, reproduce the example's dimensions and values in a separate cube.
Training input data
| Year | Month | Product | Measure | Value |
|---|---|---|---|---|
| 2026 | Jan | Tea | Revenue | 100 |
| 2026 | Jan | Coffee | Revenue | 80 |
Blocks, connections and exact settings
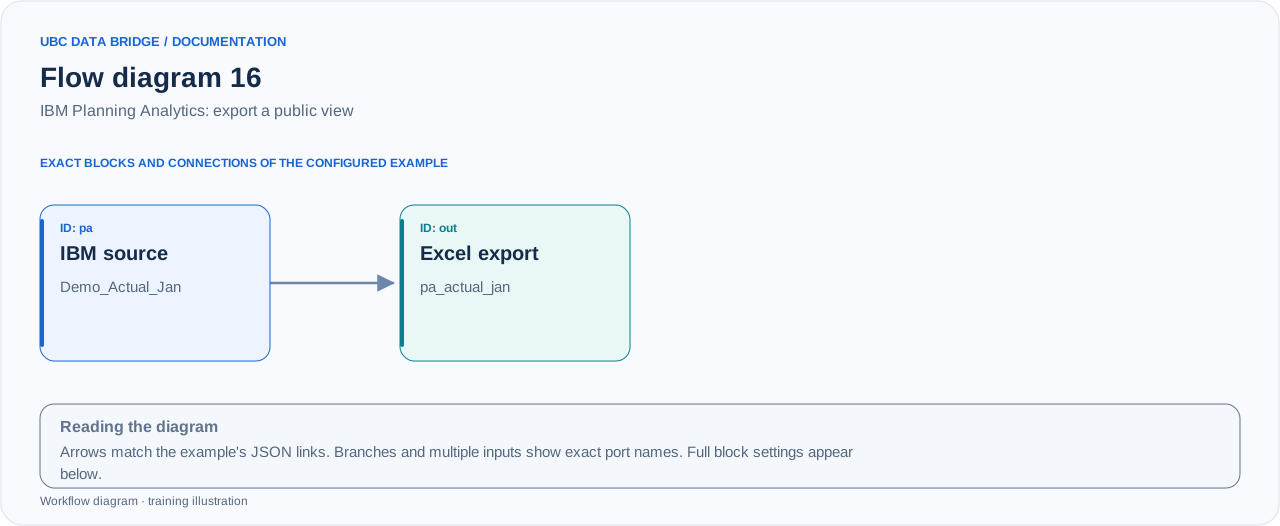
Example 16 topology: 2 blocks, 1 connection. Node identifiers and ports from the configured graph are preserved.
Add the listed blocks in the designer, open each block's properties and set these values. Names demo_* identify training sources and connections.
| Block | Setting |
|---|---|
| 1 Connection pa |
|
| 2 Data export out |
|
Port connections
- pa
out→ outin
Complete graph configuration as JSON
{
  "version": 3,
  "nodes": [
    {
      "id": "pa",
      "type": "connection",
      "label": "pa",
      "config": {
        "role": "source",
        "connection_id": "demo_pa",
        "object_type": "cube",
        "cube": "DemoSales",
        "read_mode": "view",
        "view": "Demo_Actual_Jan",
        "value_column": "Amount",
        "columns": "fields"
      }
    },
    {
      "id": "out",
      "type": "export",
      "label": "out",
      "config": {
        "format": "xlsx",
        "filename": "pa_actual_jan",
        "destination": "download",
        "delimiter": ";",
        "timezone": "Europe/Kyiv"
      }
    }
  ],
  "edges": [
    {
      "source": "pa",
      "target": "out",
      "source_port": "out",
      "target_port": "in"
    }
  ]
}
Expected result
| Year | Month | Product | Measure | Amount |
|---|---|---|---|---|
| 2026 | Jan | Tea | Revenue | 100 |
| 2026 | Jan | Coffee | Revenue | 80 |
Prepare Demo_Actual_Jan beforehand with these two cells. Value is renamed through value_column=Amount; the total is 180.
Run and verify
- Create training IBM PA connection demo_pa and test access to cube DemoSales.
- In IBM PA, prepare a public view named Demo_Actual_Jan with the specified slice and two nonzero cells.
- Select the cube and view from the source block's lists, save and run the flow.
- Check coordinates, a count of 2 and a total of 180 in pa_actual_jan.xlsx.
Common errors
- This source does not support a private view; a public view is required.
- The view's contents and settings determine the actual selection; its name alone does not define a filter.
- If the connection user cannot see the cube or view, check IBM PA permissions.